To help you to respond in time to possible incidents in the operation of your services, we have created a free monitoring service.
Free monitoring service is available for our clients with active orders.
You can check the availability and content of various services, as well as the validity of SSL certificates.
Checks are carried out from several regions with a frequency of 1-5 minutes. An incident is considered detected if it is confirmed in several regions. In this case, you will receive a notification by email and/or Telegram, depending on your choice.
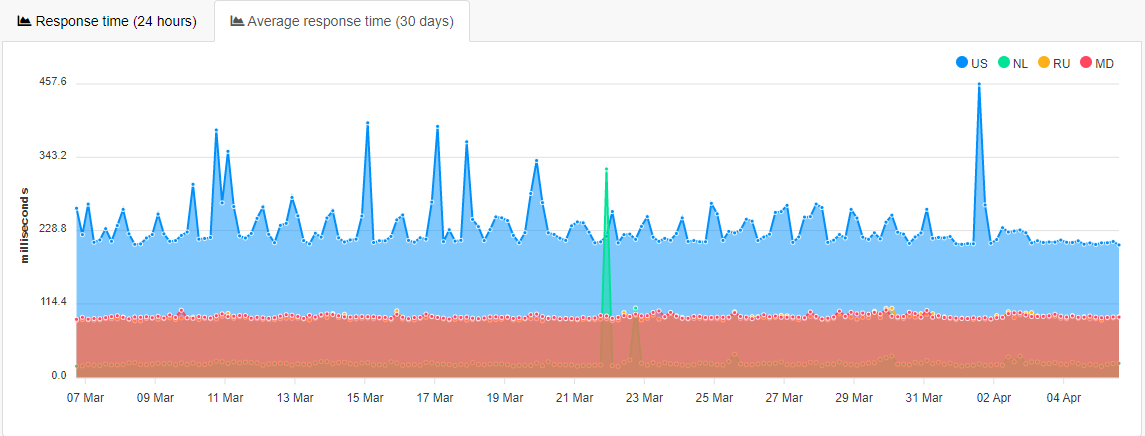
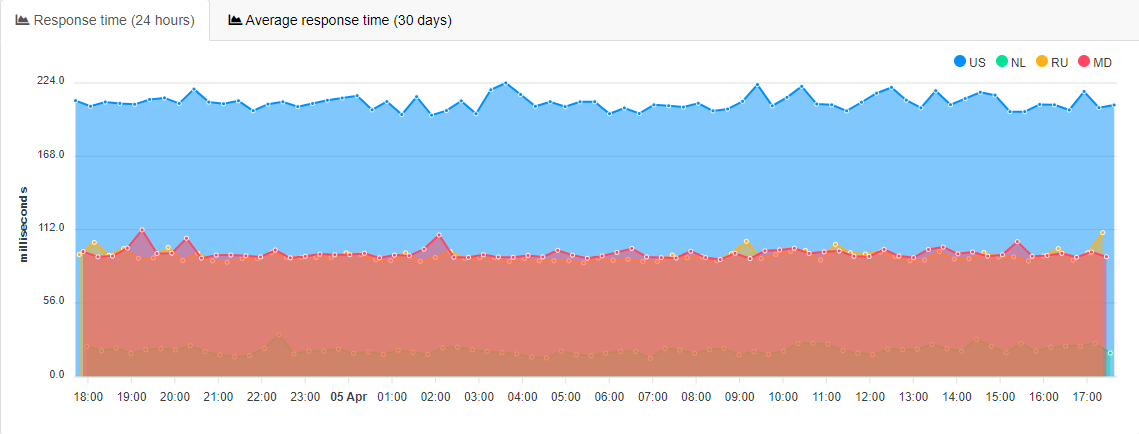
In addition, each task has graphs of the average response time and logs of incidents and events.
If you have less than five servers, you can create up to ten monitoring tasks.
As the number of orders increases, you can create two monitoring tasks for each active order.
If you need more tasks, please contact our managers with a request.
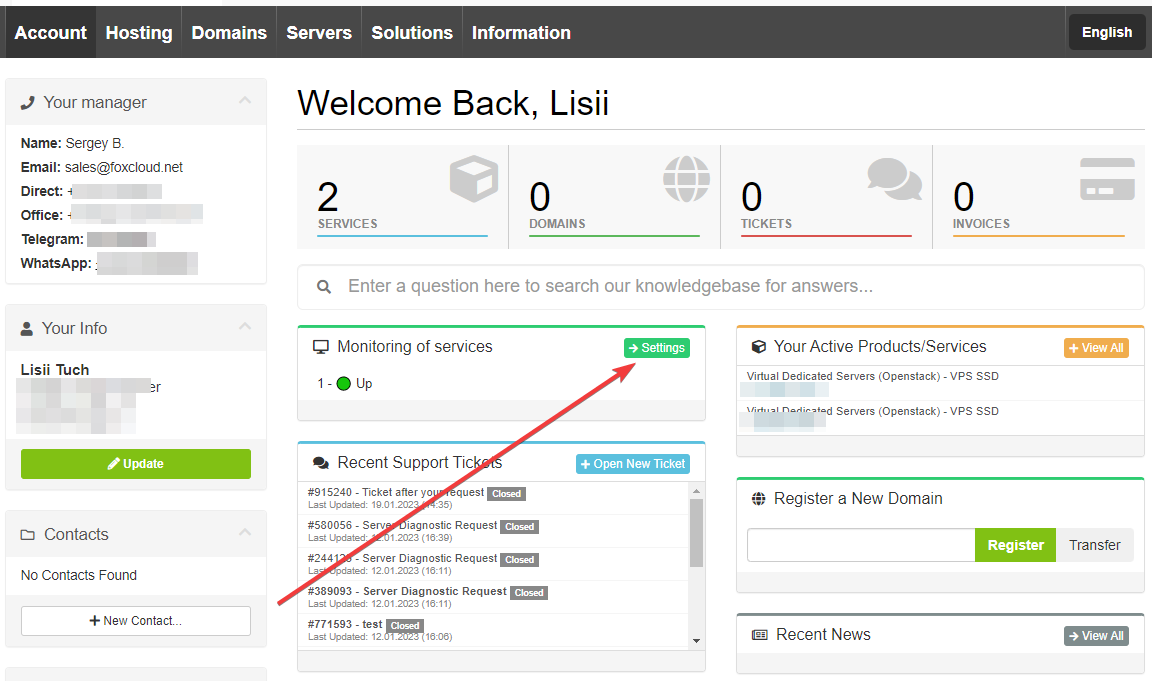
1) You can enter the monitoring control panel from your personal account - the section Services operation monitoring on the main page of your account. Or through the tab in the main menu Account - Services - Free monitoring.
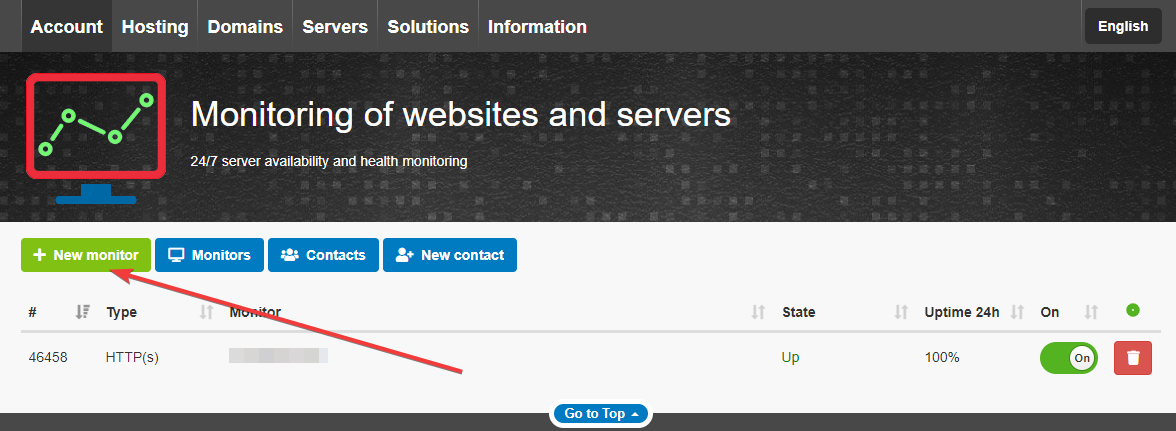
2) In the window that opens, click the New task button
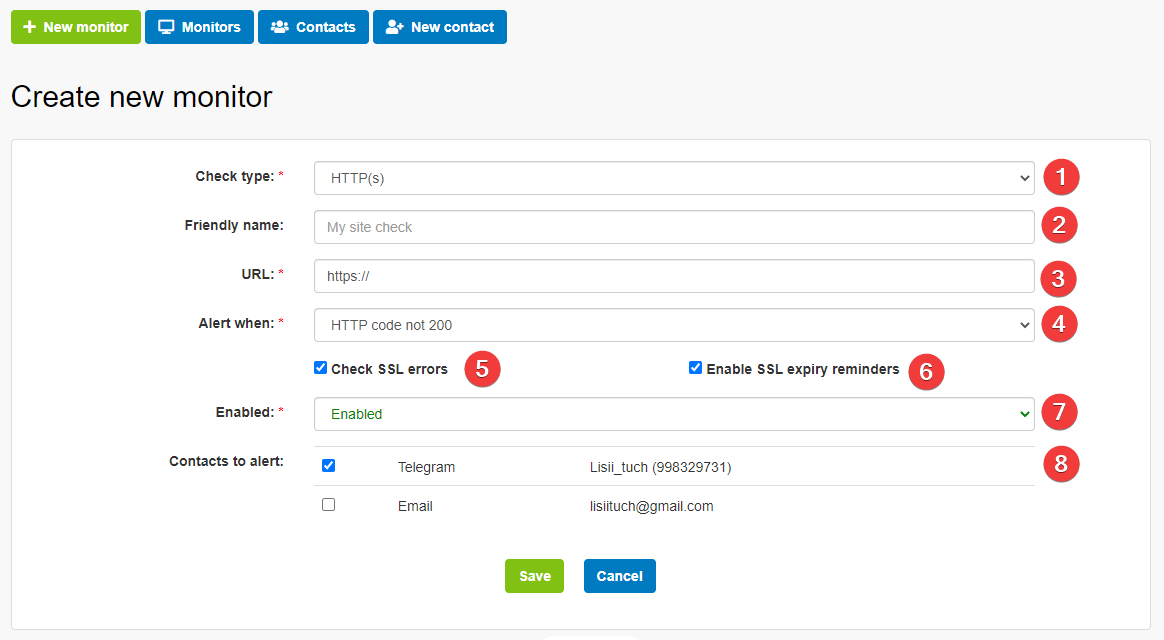
For this type of check, you can set up an event notification HTTP code other than 200, such as 500 (Internal Server Error), or check for the presence or absence of keywords on a site page.
For this type of task, you can also configure the SSL error checking and notifications for certificate expiration.
1 – select HTTP(s) check type
2 – fill in the name of the task
3 –fill in the site URL for verification. You can also check third party sites
4 – configure notification type: when HTTP code is not 200, the keyword not found or found
5, 6 – check the checkboxes for SSL verification, if necessary
7 – enable or disable the task
8 – select contacts for notifications
Click the "Save" button
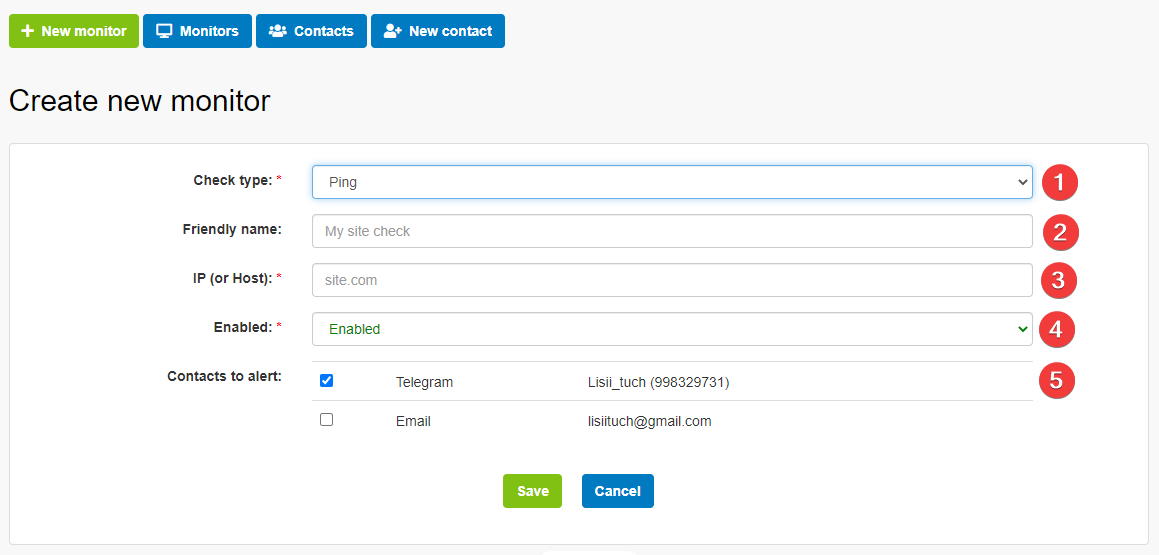
Checks the connection with the server:
1 – select Ping check type
2 – fill in the name of the task
3 – fill in the server IP address or hostname
4 – enable or disable the task
5 – select contacts for notifications
Click the "Save" button
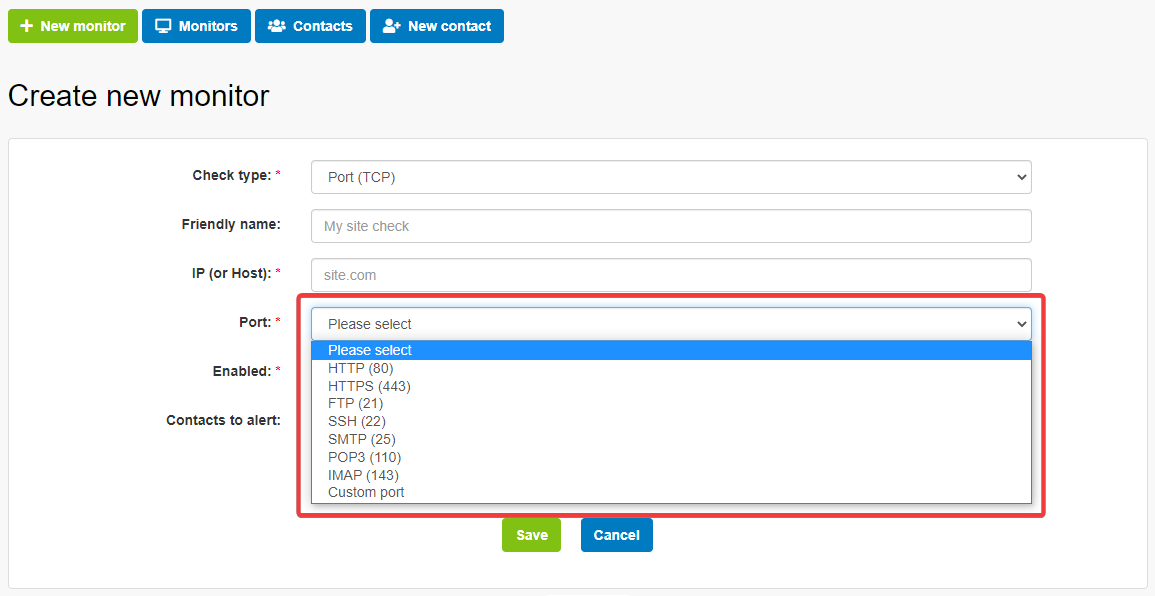
Можно выбрать порт из предложенного списка или указать свой вариант. Остальные действия аналогичны описанным выше.
By default, the email address you provided when registering your account is available for notifications.
You can add additional email addresses, for example, your system administrator’s email address, and also set up notifications in Telegram.
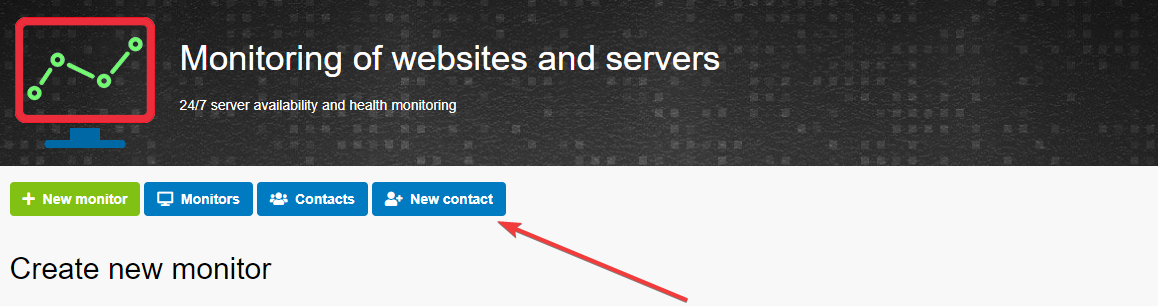
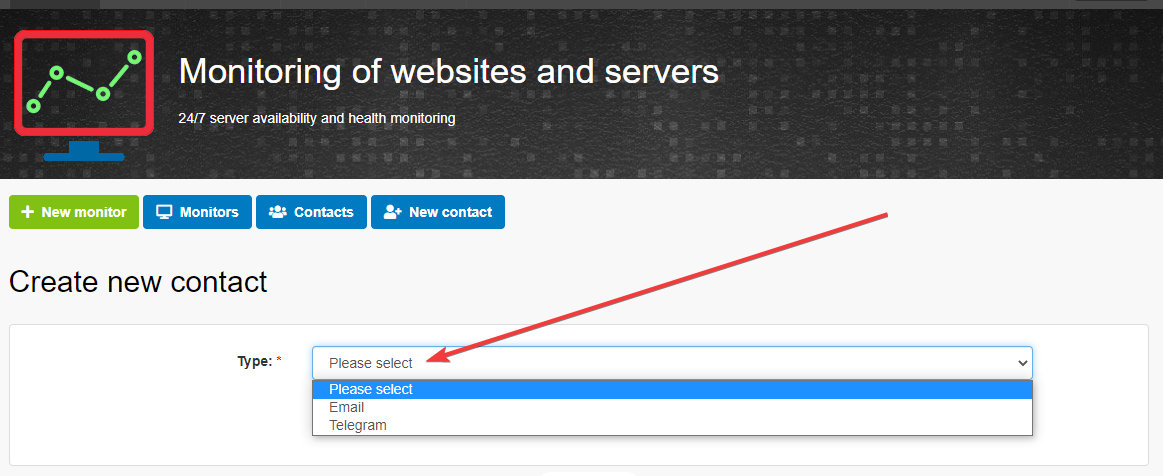
To add a contact, click on the "+ new contact" button on the monitoring page.
Select the contact type: email address or Telegram
To add an email address, you must enter it in the appropriate field. An email with a confirmation link will be sent to the indicated address. Once you click on the link, notifications from the monitoring system will be sent to this email address.
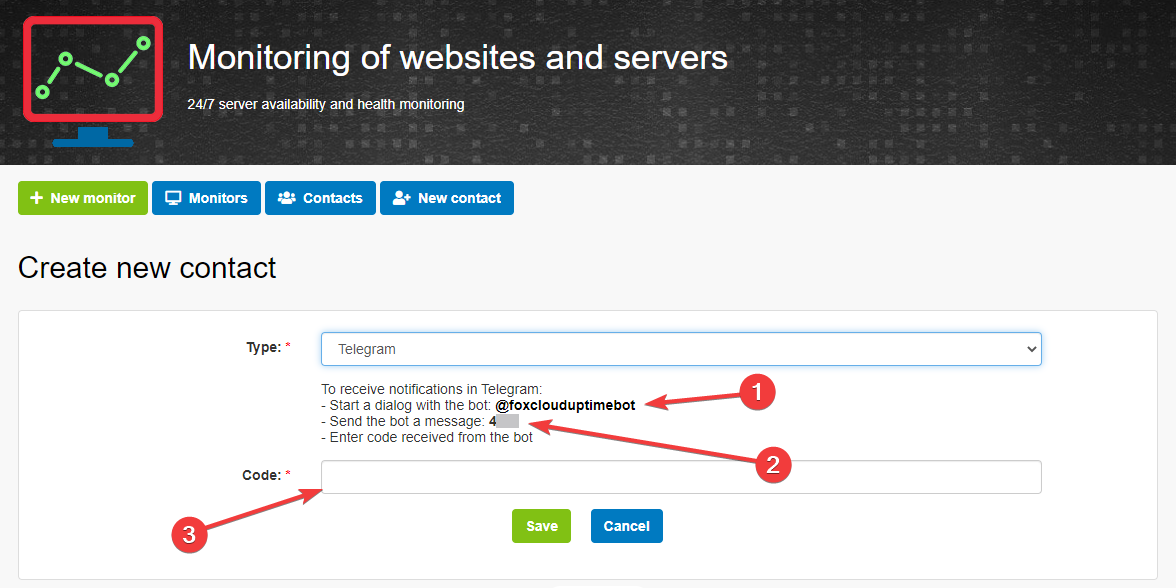
To add a Telegram contact, select this type of contact and then follow the instructions:
1) find @foxclouduptimebot bot in the Telegram app
2) send it a message with the four-digit code indicated in the form
3) paste the code received in the response message into the appropriate field on the site.
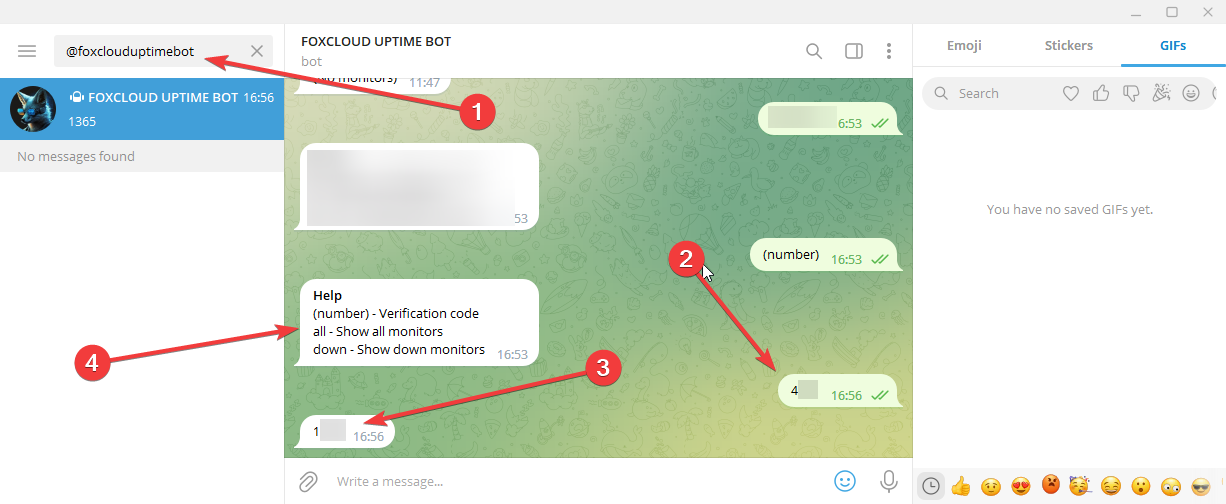
In Telegram:
1) Paste the name of the bot into the search bar
2) enter a four-digit code from the form
3) copy the code received in response and paste it into the field in the form and click the Save button.
4) After registration, you can communicate with the bot using simple commands: all - show all monitoring tasks, down - show only tasks with incidents, (number) - enter a new code. One telegram account can be linked to multiple Foxcloud monitoring accounts.
The same contact may be used for multiple tasks in different monitoring accounts.
After creating a task, statistics is gathered for a while.
Then, for each task, the main parameters of the current status and Uptime will appear.
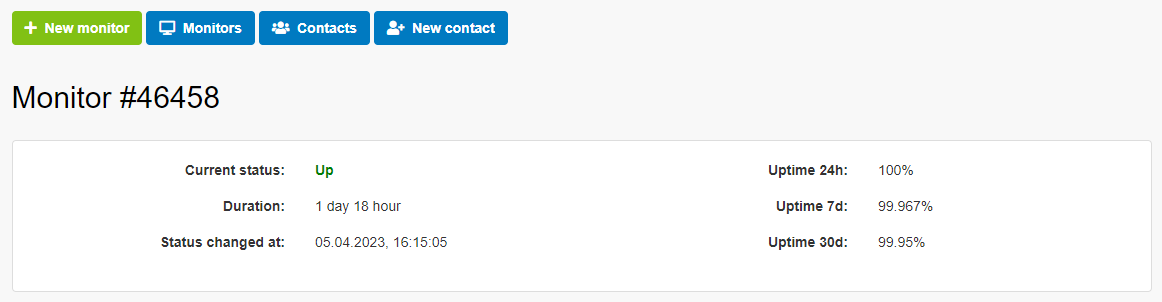
Below you can see the following graphs:
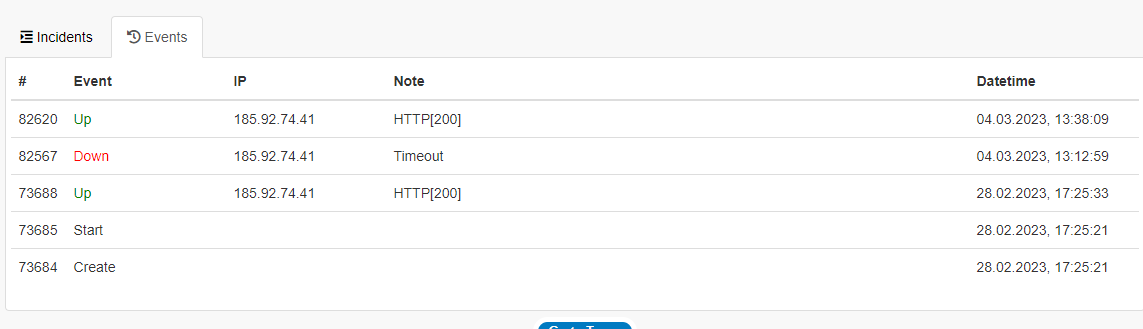
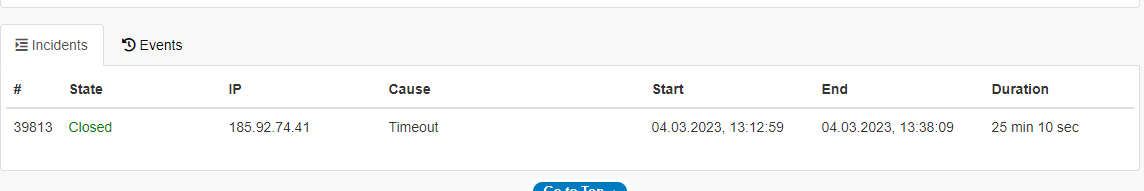
Also, for each task, logs of events and incidents are displayed: